14 June 2023
By Dave Kranzler, kinesis.money:
In my opinion, the precious metals sector is beginning to “sniff” the prospects of a likely reversal in the Fed’s monetary stance, possibly before the end of 2023.
Recently, I presented the argument that, based on the set-up between the bank net short position and the hedge fund net long position in COMEX gold and silver futures, the prices of gold and silver likely were headed lower, with help from the COMEX banks, based on previous cyclical open expansion and contraction patterns.
Well, it seems that this cycle may have been interrupted and that interruption may be coming from the physical gold and silver markets.
Gold and silver to rise in Q3 2023?
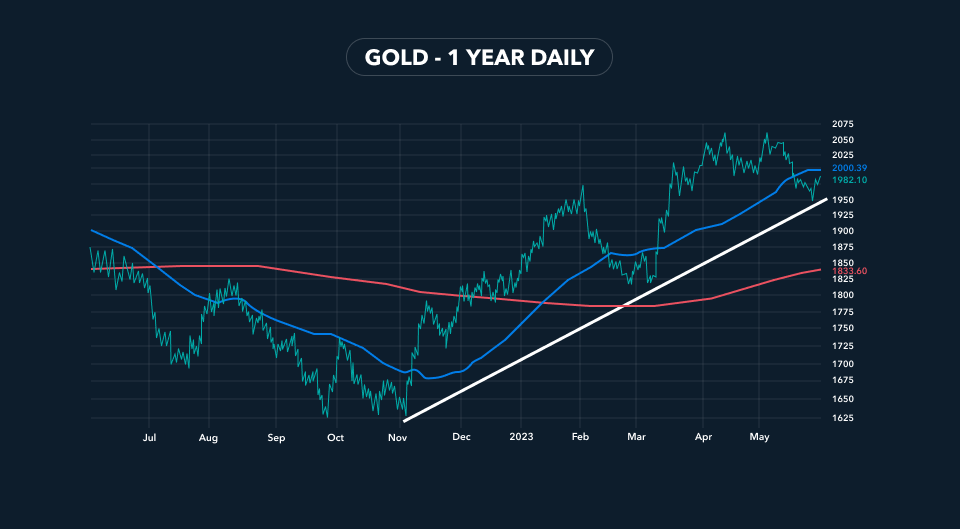
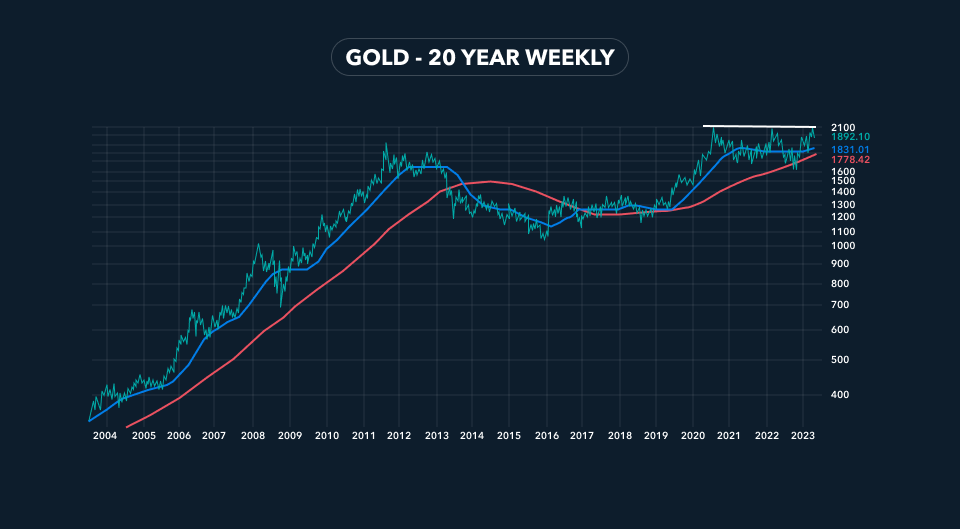
First I want to look at two charts that suggest to me that gold price (and silver price) may be set up for a big move higher:

The chart above is a 1-yr daily of the gold price. The price has bounced off the uptrend line I sketched. The RSI & MACD (not shown) are both extremely oversold and have turned higher.

The second chart is a 20-weekly gold. I wanted to show and update that massive cup & handle formation that captivated precious metals investors a year ago. It appears that the “handle” portion may be ready to break up or down. Based on both fundamental factors and developments in the physical market, I think it’s more likely that the handle breaks higher.
Gold (and silver) began to reverse course higher in the last week when it became apparent that the Treasury debt ceiling would be raised again.
Impact of US government decision-making on gold and silver prices
It seems silly for the U.S. Government even to pretend that there’s any limitation on the amount of debt the Treasury will be allowed to issue.
Furthermore, unless the Fed does not mind the considerably higher rate of interest that will be required to attract enough investors to fund the coming massive Treasury issuance, there will be either a huge draw-down in the Fed’s reverse-repo facility to fund the new Treasuries or the Fed will have to monetize a material portion of the new issuance. Either scenario will further devalue the dollar and translate into higher price inflation.
Eastern and Industrial demand for gold and silver
In addition, there are signs of enormous demand for physical gold and silver in China, India and, possibly, on the COMEX.
Many of you likely have heard about the massive drawdown in silver from the silver vaults on the Shanghai Futures Exchange. For the week ended May 16th, 5.2 million ounces were removed and for the week ended May 23rd, 4.8 million ounces left the vaults. The World Silver Survey 2023 references the SFE seeing an 18% fall in volume.
Apparently, industrial companies like solar cells, electric vehicle and chip producers have been stockpiling large quantities of silver. In addition, data from the People’s Bank of China, the Chinese central bank, shows that the PBoC increased its gold holdings by 16 tonnes during May. This is the seventh consecutive month that the PBoC officially reported an increase in gold holdings.
Reuters reported that the ex-duty import premiums on gold bars in India climbed into positive territory. Positive premiums disappeared when the import duty was jacked to 15%, which in turn increased demand for smuggled gold.
Premiums go positive when there’s more demand for gold from the populace than there is gold supply flowing into India. Indian demand is curtailed during periods when the gold price rises rapidly, as occurred in March to early April when the price ran from the low $1800s to $2050. The recent $100 sell-off apparently fueled a big uptick in demand for gold in India.
Bullish physical redemptions
Finally, over 22,000 contracts representing more than 2.2 million ounces of gold (18% of the amount of registered gold in COMEX vaults) stood for delivery going into the June first notice date. This is the largest open interest ahead of a delivery month since August 2022 (August is the largest delivery month). Any account with open contracts the night before first notice must be funded to accept delivery or the position gets liquidated. These are accounts that likely will take delivery of the underlying gold (contracts not yet noticed can be sold).
In the first two days of the delivery period (through Wednesday, June 1st) 68% of the open contracts representing 12.5% of the 12 million ounces in the registered vault accounts received delivery notice.
For historical context, this is a relatively large amount of gold to be delivered on a monthly basis, especially just two days into the delivery month. It will be particularly bullish if more contracts are purchased as the month progresses. The June contract is tradeable until June 28th, which means there’s potential for a lot more gold deliveries. I will qualify the bullishness of this particular data by saying that it will be considerably more significant if the gold delivered this month is removed from COMEX vaults and into private safekeeping, as it will reduce the amount of gold that can be hypothecated by the banks for “deliveries.”
The point of describing the recent increase in demand for physical gold is that it supports the case I made for a potential bottom to the recent pullback/correction in gold and silver prices. As well, the enormous demand for physical gold and silver could be the fuel for the next cyclical bull move higher in the precious metals sector.
Read more at the original source here:
